Digital Marketing Results

Proof, Not Promises.

Real screenshots from real client accounts — SEO growth curves, ad-account returns, and the tracking work behind them. Numbers first; the story of each one below.

1,050%Best return on ad spend
$500K+Tracked sales generated
+4,701%Peak organic search growth
390KSessions in a single year
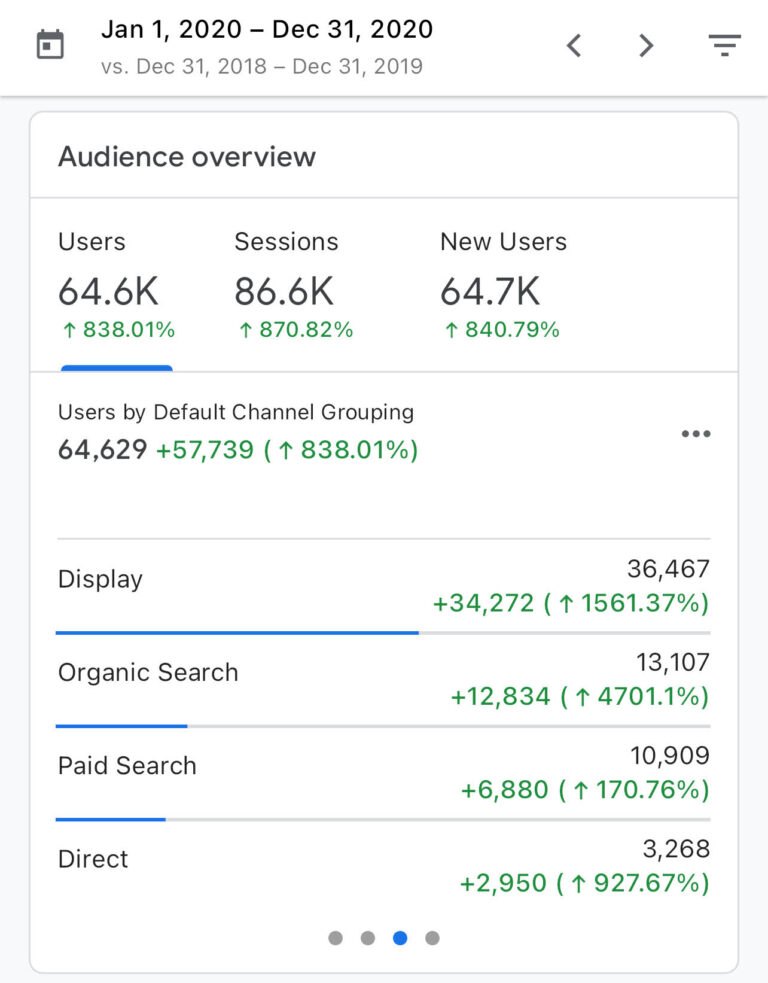
Google Analytics — users up 838% in 2020

Google Analytics — tap to view full size

01 — SEO & Content
+838% Users

From a standing start to 64.6K users

The year we got serious about SEO and content for this brand, everything changed. Users grew 838%, sessions climbed 870%, and organic search traffic alone exploded by 4,701%. This is what happens when strategy replaces guesswork.

Organic Search +4,701%
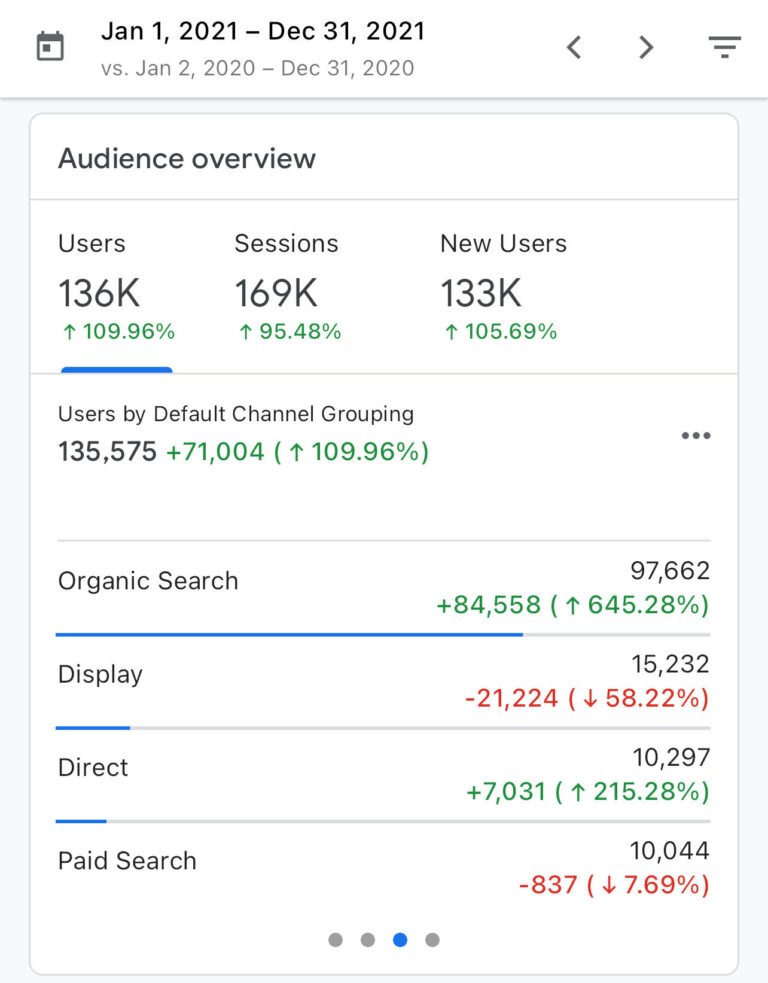
Google Analytics — 136K users in 2021, up 110%

Google Analytics — tap to view full size

02 — SEO & Content
136K Users

Then we more than doubled it

Growth that compounds: the following year we pushed the same brand from 64.6K to 136K users — up another 110% — with organic search up 645%. Real growth isn't a spike. It's a system that keeps working.

Organic Search +645%
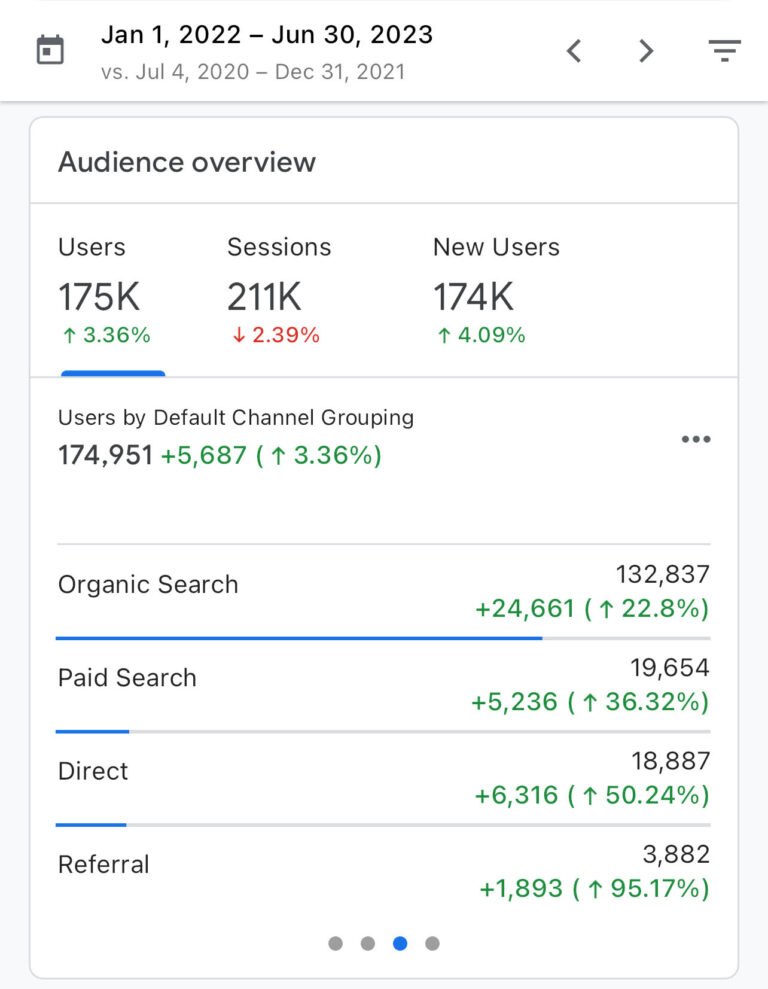
Google Analytics — 175K users through 2022–2023

Google Analytics — tap to view full size

03 — SEO & Content
175K Users

Year three: still climbing

175K users and 211K sessions over the next eighteen months. Organic search up 22.8%, referral traffic up 95%. When the foundation is right, growth stops being a campaign and becomes the default.

Referral +95%
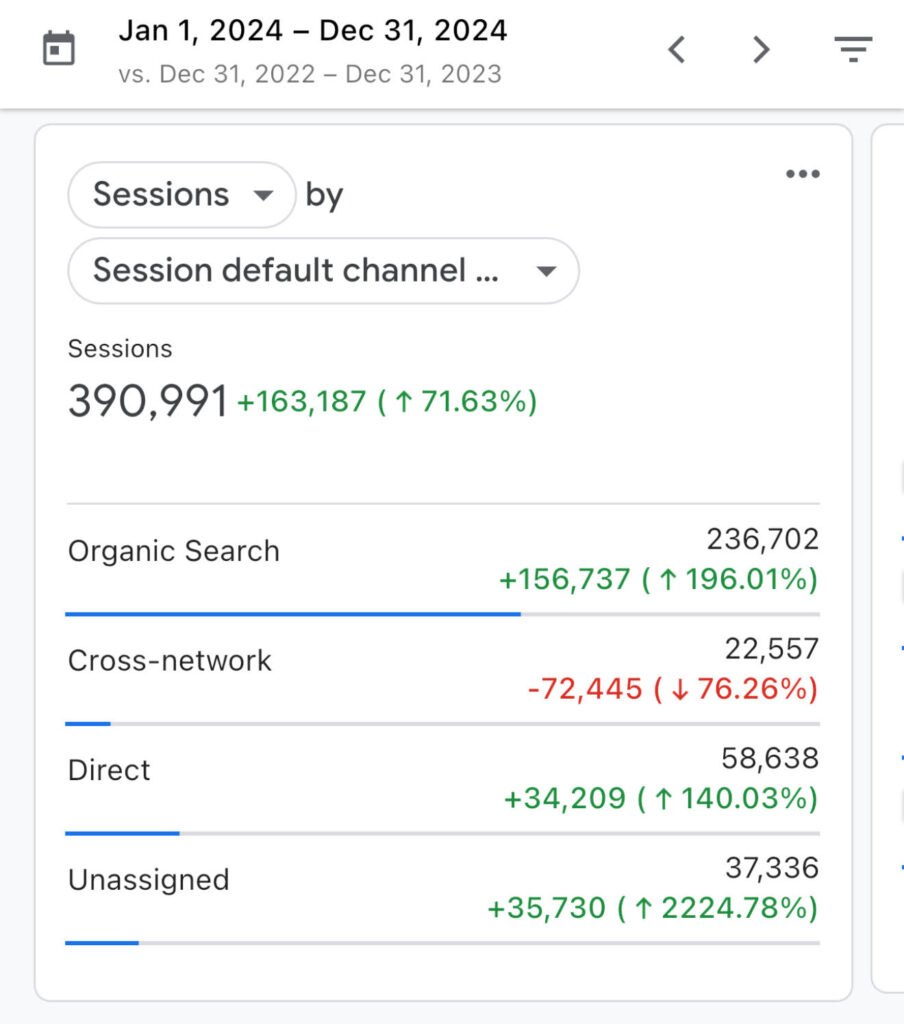
GA4 — 390,991 sessions in 2024, up 71.63%

Google Analytics 4 — tap to view full size

04 — SEO & Content
390,991 Sessions

Nearly 400K sessions in a single year

A 71.63% jump in total sessions, driven by organic search growing 196% year over year. No shortcuts — just consistent SEO, content that answers real questions, and patience that paid off 163,187 extra sessions.

Organic Search +196%
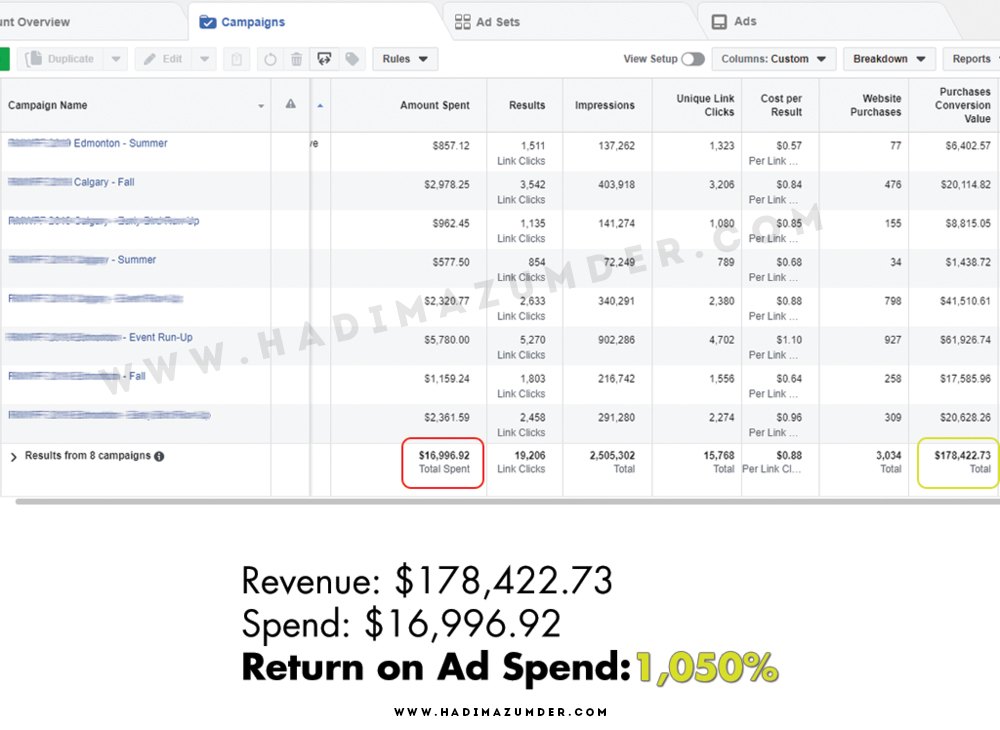
Facebook Ads — $16,996 spend, $178,422 revenue, 1,050% ROAS

Meta Ads Manager — tap to view full size

05 — Paid Advertising
1,050% ROAS

Turning $16,996 into $178,422

Eight Facebook campaigns, $16,996.92 in ad spend, $178,422.73 back in tracked purchases — a 1,050% return on ad spend. Built on relentless creative testing, sharp audiences, and killing what doesn't convert, fast.

8 Campaigns · 3,034 Purchases
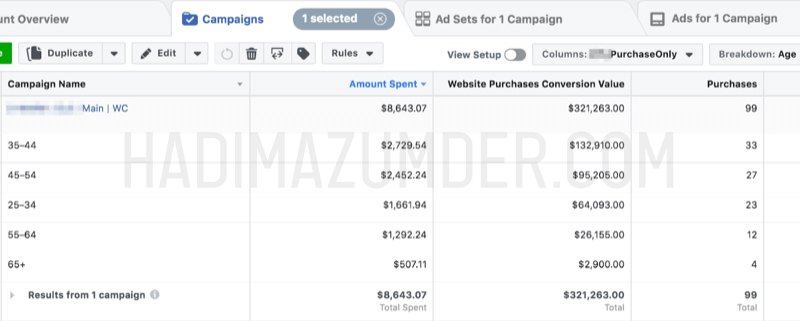
Facebook Ads — $8,643 spend, $321,263 conversion value

Meta Ads Manager — tap to view full size

06 — Paid Advertising
$321,263 in Sales

One campaign. Ninety-nine purchases.

A single well-built campaign: $8,643 spent, $321,263 in website purchase conversion value from 99 purchases. The age-breakdown data told us exactly who was buying — so we let the budget follow the buyers.

37x Return
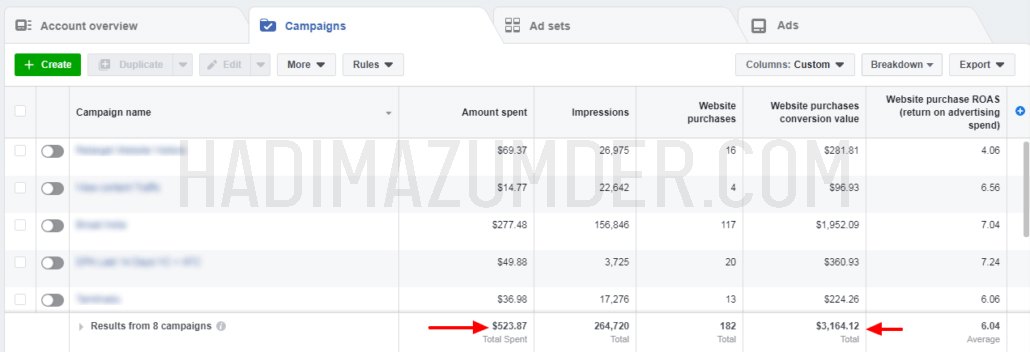
Facebook Ads — $523 spend, $3,164 value, 6.04 ROAS

Meta Ads Manager — tap to view full size

07 — Paid Advertising
6.04x Return

Small budget, serious efficiency

You don't need a big budget to get real results. $523.87 across eight lean campaigns produced $3,164.12 in tracked sales — a 6.04 average ROAS. Efficiency first; scale comes after.

182 Purchases
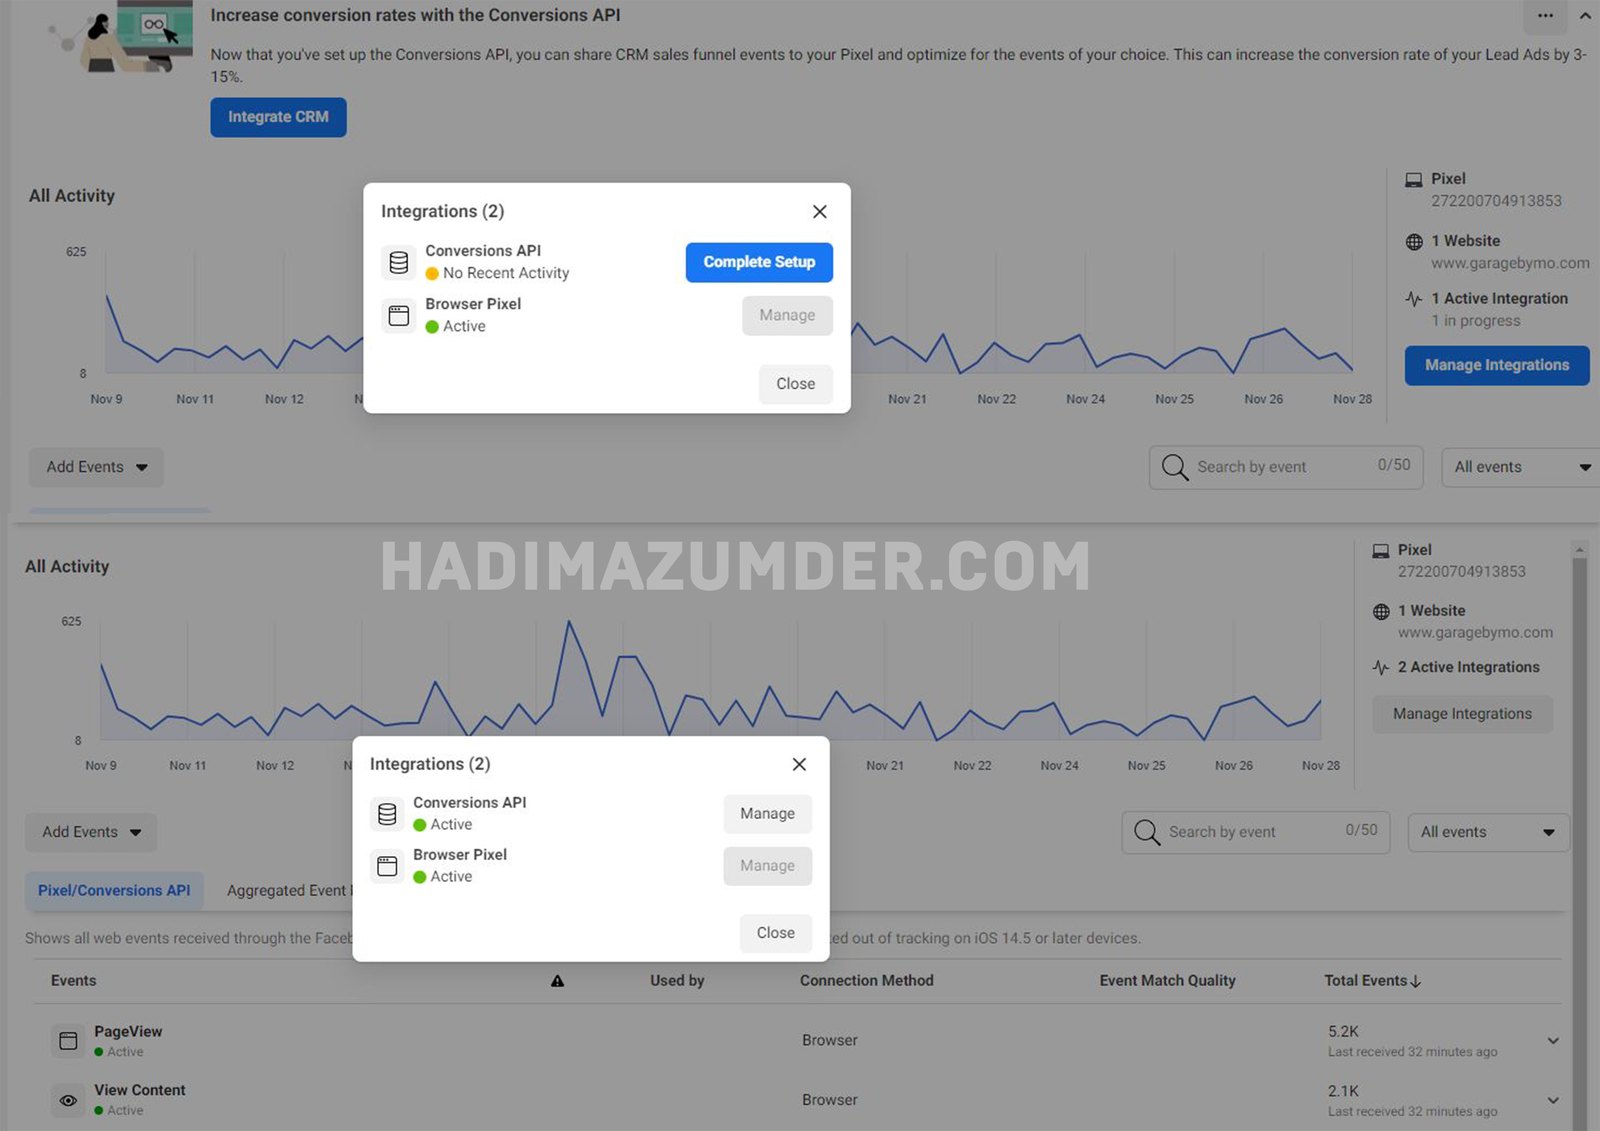
Meta Pixel and Conversions API both active

Meta Events Manager — tap to view full size

08 — Tracking & Data
2/2 Active

Fix the tracking, then scale

Before spending another dollar, I rebuilt this account's measurement: Meta Pixel plus the Conversions API, both verified active. When every sale is tracked properly, optimization finally has real data to work with — and ad money stops leaking.

Pixel + Conversions API
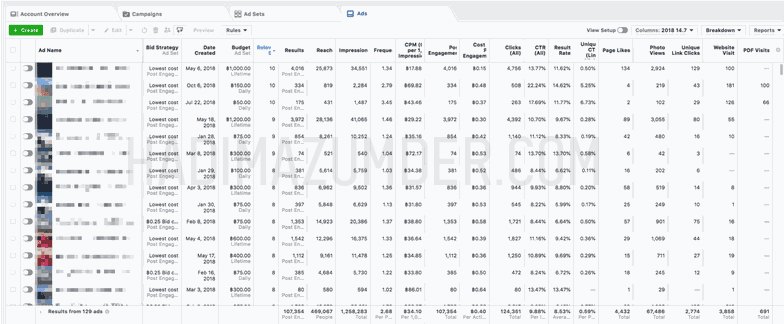
Ads Manager — 129 ads, 1.25M impressions

Meta Ads Manager — tap to view full size

09 — Testing at Scale
1.25M Impressions

129 ads. Winners found, not guessed.

Winners aren't guessed — they're found. This account ran 129 ad variations generating 107,354 results and over 1.25M impressions. Systematic testing across creatives, hooks, and audiences is how average accounts become profitable ones.

129 Ad Variations
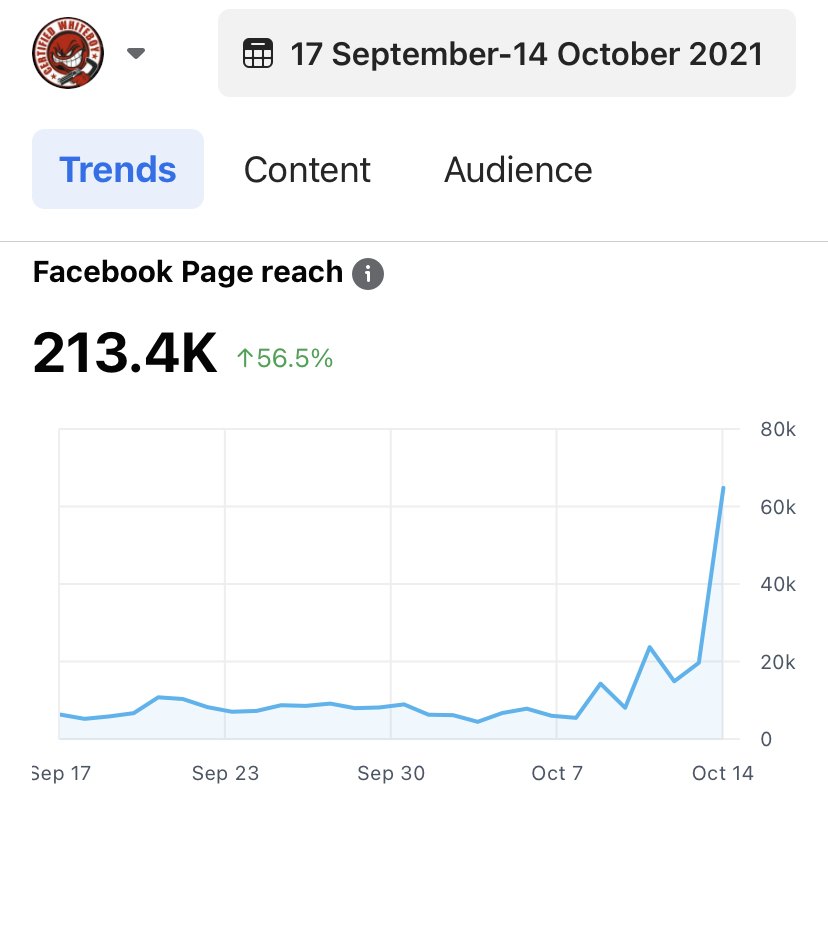
Facebook page reach 213.4K, up 56.5%

Meta Business Suite — tap to view full size

10 — Organic Social
213.4K Reach

The hockey stick, four weeks in

Certified Whiteboy's Facebook page reach up 56.5% in a single month — look at that end-of-month curve. The right content, posted with intent, turned a flat line into a hockey stick.

+56.5% in 4 Weeks
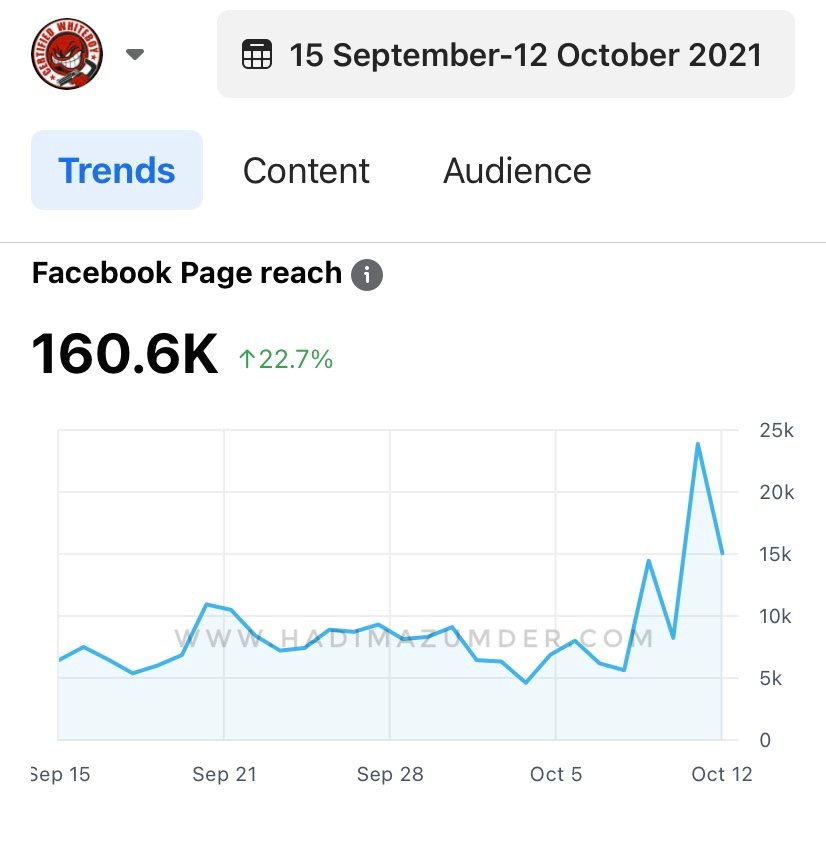
Facebook page reach 160.6K, up 22.7%

Meta Business Suite — tap to view full size

11 — Organic Social
160.6K Reach

The month the line bent upward

160.6K page reach, up 22.7% — the early phase of the same growth push. First you bend the curve, then you keep it bending. Consistency beats virality.

+22.7% Month on Month

Your brand could be the next screenshot.

These results came from strategy, testing, and honest work — the same process I'd bring to your project.

Start a Project See My Design Work